A DTC reconciliation demo built to reclaim 12 hours a week
A modeled Shopify scenario for reconciling orders, payouts, and 3PL data, backed by a runnable demo that matched 190 of 240 synthetic orders and routed the rest to human review.
No client outcome is claimed. The figure below is a modeled scenario; inspect the assumptions before applying it to your business.
- Modeled Year-1 savings
- $29,330
- Modeled time reclaimed
- 12 hrs/wk
- Synthetic test run
- 240 orders
- Auto-match rate
- 79%
Demo-tested system. Synthetic data. Modeled savings. No client outcome is claimed. The runnable demo and its assumptions are shown below.
The morning that can eat nearly three hours
A common mid-seven-figure DTC scenario starts with four tabs: Shopify orders, the payment processor’s payouts, the 3PL’s fulfillment export, and a master spreadsheet. The operations lead has to make them agree. Which orders shipped? Which payouts match which batch? Where did the numbers drift, and why?
In this model the work averages 14 hours a week. A chargeback wave, a shifted export column, or a promotion that breaks SKU mapping can turn it into a whole morning. The process also tends to live in one person’s spreadsheet logic, which makes it hard to hand off.
This is the quiet kind of cost. Nobody puts “manual reconciliation” on a budget line. It just sits inside a salary, invisible, until you measure it.
What it was actually costing
The sample audit separates current cost from the share a system can realistically recover:
| Line item | Before |
|---|---|
| Labor | 14 hrs/week × $42/hr × 48 weeks; 85% reclaimed and measurably redeployed |
| Tools | $145/month reconciliation add-on fully replaced |
| Errors & rework | $9,600 current annual cost; 60% preventable in the base case |
| Running cost | $180/month deducted for automation runtime and monitoring |
The base case produces $29,330 in modeled Year-1 savings, with a planning range of roughly $22,100 to $33,700. It does not count the same hour twice as both labor and opportunity value.
Why we scope narrow first. We could have proposed a sprawling “ops automation platform.” Instead we picked the single most repetitive, most costly, least-changing task. Narrow scope means a working system in days and a savings number that’s easy to verify, which is the whole point of the model.
What the demo does
The runnable demo uses three synthetic source files with partial refunds, split shipments, shifted columns, and payout drift:
- A scheduled import of orders, payouts, and the 3PL export before the team logs on.
- A matching engine that pairs orders to payouts and fulfillment records, tolerant of the messy real-world cases (partial refunds, split shipments, currency rounding) that broke the manual process.
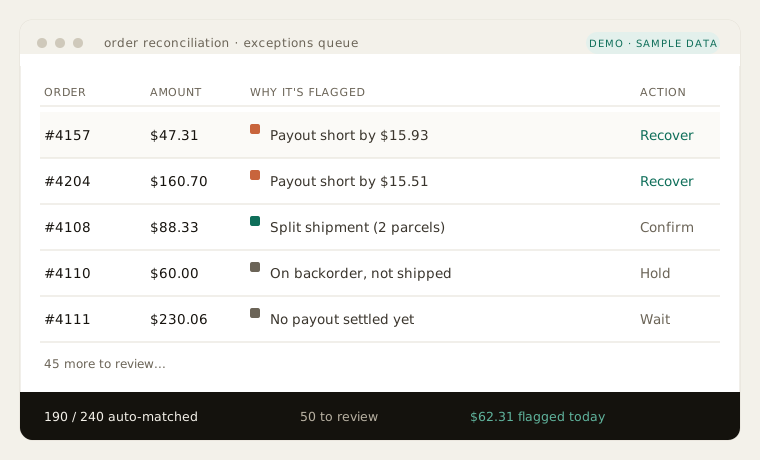
- An exceptions queue: instead of reconciling everything by hand, the ops lead now reviews only the handful of records the system couldn’t match confidently, with the reason attached.
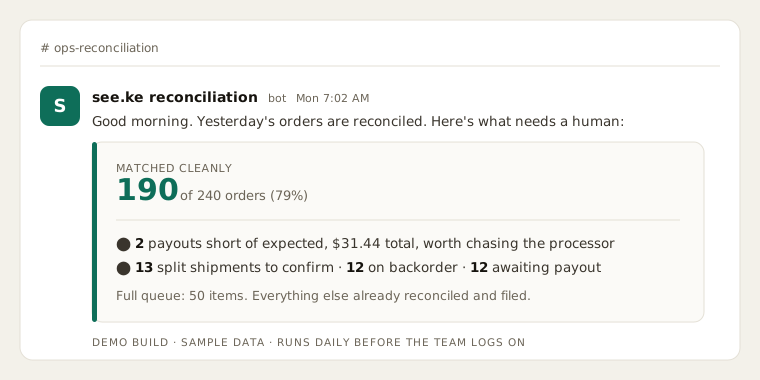
- A clean daily summary with matched totals, flagged exceptions, and payout drift.
On the synthetic run, 190 of 240 orders matched automatically. The remaining 50 were not hidden or forced through; they went to a human queue with a reason. That 79% match rate is the proof available today. A production build would establish precision, false-match rate, and review time on the client’s own data before delivery.
How the savings would be verified
The model assumes the 14-hour week falls to roughly 2 hours of exception review, monitoring, and corrections. A real engagement would measure review minutes, false matches, written-off discrepancies, tool costs, and runtime costs against a signed baseline. If the client cannot measurably redeploy or remove the reclaimed capacity, that portion is not counted as cash savings.
Base modeled Year-1 savings for this scenario are $29,330. The delivery fee would be $14,665. If verified savings later came to $25,000, the corrected fee would be $12,500 and See.ke would refund $2,165, provided the system was used as scoped.
See it run
We ran the system on a synthetic store: 240 orders, three messy source files, partial refunds, split shipments, a shifted 3PL export, cent-level payout drift, and two deliberate short-payments. It auto-matched 190 and put the rest in a queue with the reason attached.
The reusable part
Order-payout-fulfillment reconciliation looks different at every store, but the shape repeats: normalize, match, explain exceptions, and reconcile money. The demo proves the pipeline can run. It does not prove a client outcome. That distinction stays visible until production measurement exists.
If your team starts the day making two systems agree, that’s a candidate. Book a free Savings Audit and we’ll measure what it’s really costing you. You keep the number either way.