The weekly report that cost a company $39,000 a year
An ops-heavy SMB rebuilds the same management report by hand every Monday. Here is the reporting pipeline we build in about five days and the roughly $39,000 in Year-1 savings it typically frees up, plus a report that's finally on time.
No client outcome is claimed. The figure below is a modeled scenario; inspect the assumptions before applying it to your business.
- Modeled Year-1 savings
- $39,000
- Build time
- 5 days
- Analyst hours saved
- 8 hrs/wk
- Report delivery
- Mon 7am
Representative build. This describes a system we build and the numbers typical for it, drawn from published benchmarks and our baseline model. Verified, client-signed studies will replace representative ones as permissions land.
A spreadsheet held together by one person
Every Monday, an analyst at a 60-person company sat down to build “the report”, the weekly numbers the leadership team ran the business on. It meant exporting from three systems, pasting into a master workbook, fixing the formulas that broke when a column moved, formatting the charts, and emailing it around. Usually by Monday afternoon. Sometimes Tuesday.
Two problems hid inside that routine. First, it ate the better part of a day every week from someone hired to analyze numbers, not assemble them. Second, the whole thing lived in one person’s head and one fragile file. When they were on holiday, the report simply didn’t happen.
What we measured
This one was refreshingly easy to baseline:
- Labor: ~8 hours/week assembling the report, at the analyst’s loaded rate.
- Fragility: weeks where the report was late or skipped, and the cost of decisions made without it.
- Tools: a BI add-on bought to “fix reporting” that nobody had the time to set up.
For a company this size the baseline comes to about $39,000/year for a report that is, ironically, supposed to save money by informing better decisions.
Five-day build. This is the kind of process the model is built for: high-frequency, fully repeatable, and unambiguous to measure. A working version lands in about five days and the savings re-measure cleanly inside a month.
What we built
A reporting pipeline that does on a schedule what the analyst did by hand:
- Automated pulls from the three source systems every Sunday night.
- A fixed, tested template that assembles the numbers and charts the same way every time, no more formulas breaking when a column shifts.
- Delivery by 7am Monday, in the inbox and a shared dashboard, before anyone asks for it.
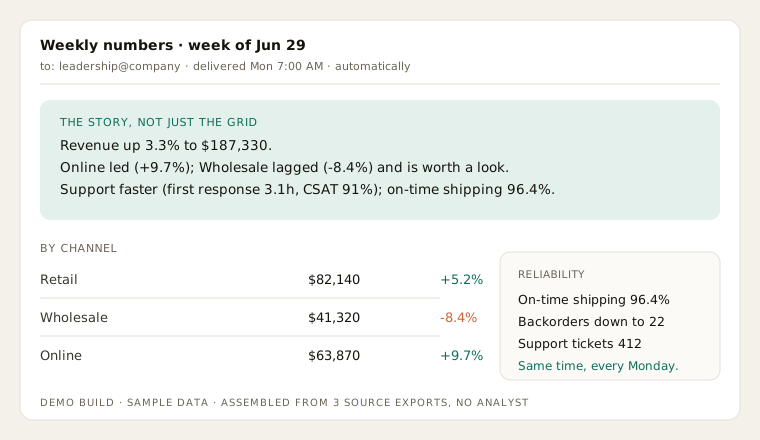
- A plain-language summary at the top (what moved, what’s up, what’s down) so leadership gets the story, not just the grid.
Because it runs whether or not any one person is at their desk, the report stopped being a single point of failure.
The result
Eight hours a week of senior analyst time came back, redeployed to actual analysis. The report now lands at the same time every Monday, holiday or not. Leadership started the week with numbers instead of waiting for them.
The $39,000 figure is a modeled scenario, not a client result. A real audit would show the labor that can be removed or measurably redeployed, residual review time, source-monitoring cost, and any replaced tool cost. The delivery fee is half of the agreed projection and is corrected if verified savings are lower.
See it run
We built the assembly pipeline and ran it on three synthetic source exports. It produces the same report the analyst made by hand, delivered at 7am Monday, with a plain-language summary on top so leadership gets the story, not just the grid.
The pattern under it
“A person rebuilds the same report on a schedule” is one of the most common (and most automatable) processes in any ops-heavy business. The assembly-and-delivery pattern we built here adapts to almost any recurring report, which makes the next one faster to ship and easier to price. One narrow, boring, perfectly measurable process: exactly where the No True Cost model shines.
If someone on your team dreads a recurring report, book a free Savings Audit. We’ll measure the real cost of it, and the number’s yours to keep regardless.